Heart Rate Detection Using Camera
April 6, 2019
Euler Video Magnification Project Link at MIT CSAIL
Introduction
The world generates countless signals as it moves ahead in time, but most of these signals are invisible to the human eye. This is due to the frequency of these signals - either it is too low to be perceived as change or it is too high for us to see the change actually occurring.
Finding a pattern in a seemingly random event is about how we process the given information and convert it into something useful. In this article, we try to connect the dots of predicting heart rate with a camera alone. For this, we tag the video frames with actual heart rate and analyze which features impact accurate prediction. For example, we examine which color signal in our RGB frames contributes towards better prediction and many more such small details.
Take for instance our eyes and our ability to understand facial expressions in others. These changes last long enough that we are able to perceive them. But changes exhibited by heart rate last for a very short period of time and hence become invisible to us. With a camera of sufficiently high frame rate, i.e. almost all modern cameras, these changes become visible. And hence we can find the heart rate.
In this blog, we are going to introduce the algorithms required and demonstrate how to read a person’s heart rate with a camera alone. The technique is called Euler Video Magnification.
Measuring Heart Rate
In order to measure your heart rate, doctors have traditionally relied upon technology that is based on monitors with leads that attach to your body. These devices measure one of the following pulses:
- Radial Pulse: Place your pointer and middle fingers on the inside of your opposite wrist just below the thumb and then count how many beats you feel in 1 minute.
- Carotid Pulse: Place your pointer and middle fingers on the side of your windpipe just below the jawbone and then count how many beats you feel in 1 minute.
- Brachial Pulse: Another location for checking your pulse is the brachial artery. This method is used most commonly in young children.
Overview of Euler Video Magnification
A computational technique for visualizing subtle color and motion variations in ordinary videos by making the variations larger. It is a microscope for small changes that are hard or impossible for us to see by ourselves. In addition, these small changes can be quantitatively analyzed and used to recover sounds from vibrations in distant objects, characterize material properties, and, in this case, remotely measure a person’s pulse.
Concept
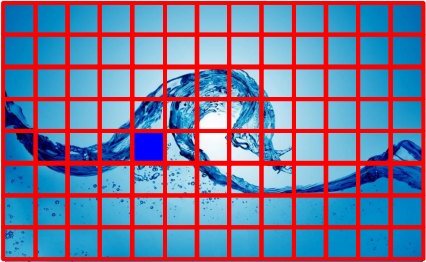
The general concept behind this algorithm is to first approximate a point on the forehead.
The intensity of this point is then decomposed into different color spaces namely Red, Blue, Green. But we prefer Red and Green colors only as Blue tends to introduce noise in heart rate detection.
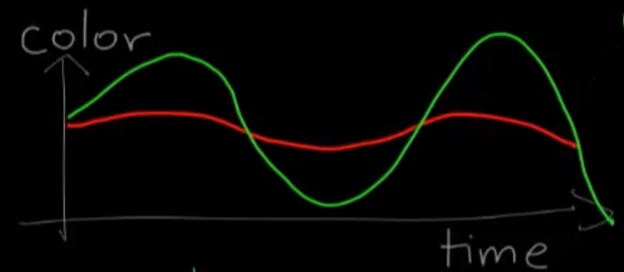
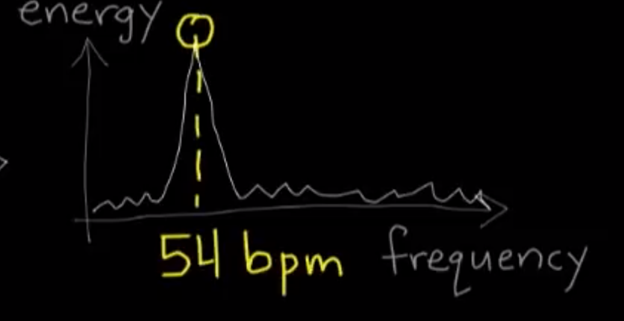
The variation in Red and Green color spaces on the location approximated on the forehead is then fed to Fourier Transform to convert the function of spatial location on the video frame and time to frequency domain which therefore helps in extracting heart rate.
What is Fourier Transform?
Fourier transform decomposes (also called analysis) a function of time (a signal) into its constituent frequencies. The Fourier transform of a function of time is itself a complex-valued function of frequency, whose magnitude component represents the amount of that frequency present in the original function, and whose complex argument is the phase offset of the basic sinusoid in that frequency. You can learn the basics of Fourier transform from this video.
What is the Fourier Transform? A visual introduction.
Now let’s talk about some amplification techniques namely Lagrangian and Eulerian. These techniques will help us in amplifying the particular frequency so that we can see change happening at that rate, in our case heart rate.
Lagrangian Perspective
The Lagrangian version of amplification is to analyze the angle of motion of the pixels of interest in the tracking image. For example, if we want to study the flow rate of the river, we take a boat, go down the river, and record the movement of the ship.

However, the Lagrangian perspective approach has the following shortcomings:
➔ It is necessary to accurately track and estimate the trajectory of particles, which requires more computational resources.
➔ The tracking of the particles is performed independently, and with the consideration that the system is closed i.e. there is no transfer of energy in and out of the frame being studied. So the lack of consideration of the overall image is prone to the fact that the image is not closed, thereby affecting the effect of the amplification.
➔ The amplification of the action of the target object is to modify the motion trajectory of the particle. Since the position of the particle changes, it is necessary to fill the original position of the particle, as there is a continuous flow in action and the system is closed therefore some other particle will take the position. This increases the complexity of the algorithm.
What is “change” — the trajectory of the pixel of interest over time, such pixels often need to be assisted by manual or other prior knowledge;
Amplify “change” — increase the amplitude of these pixels.
Eulerian Perspective
Unlike the Lagrangian perspective, the Eulerian version of amplification does not explicitly track and estimate the motion of the particle but instead fixes the perspective in one place, such as the entire image.
After that, it is assumed that the entire image is changing, but the characteristics of the signals like frequency, amplitude, etc. are varying. So we are interested in the change in the signals. In this way, the amplification of the “change” becomes the precipitation and enhancement of the frequency band of interest. For example, to study the flow rate of river water, we can also sit on the shore and observe the change of the river when it passes through a fixed place. This change may contain many components that are not related to the water flow itself, such as leaves falling on the water surface. However, we only focus on the part that best reflects the water flow rate.
What is “change” — the whole scene is changing, and the change signals we are interested in are hidden in it;
Amplify “change” — Separate and enhance the signal of interest by means of signal processing.
Explanation
Now, why are we able to extract heart rate from the sequence of frames? It is because the heart pushes blood to every part of the body and to the head particularly (towards the brain), so it changes the color and opacity of the skin. These changes can be detected by analyzing the average red or green component of the frames taken from the camera. We learned the above concepts to be able to understand the different filters required to develop the said application. The analysis is done using the following approach:
- Spatial filtering. Pyramid multiresolution decomposition of the video sequence; This is done to extract features/structures of interest, and to attenuate noise.
- Time domain filtering. Performing time-domain bandpass filtering on the images of each scale to obtain several frequency bands of interest; This is done using Fourier transform.
- Amplify the filtering result. The signal of each frequency band is differentially approximated by Taylor series, and the result of linear amplification is approximated; This is why we studied Euler amplification above.
- Composite image. The amplified image is synthesized.
The spatial and temporal processing is used to emphasize subtle temporal changes in a video.
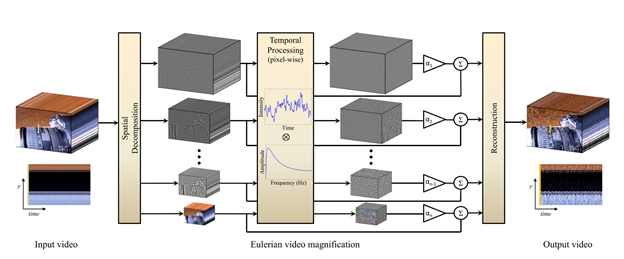
The video sequence is decomposed into different spatial frequency bands. These bands might be magnified differently due to the difference in their SNR (Signal To Noise Ratio). The goal of spatial processing is simply to increase the temporal signal-to-noise ratio by pooling multiple pixels. Then for the purpose of computational efficiency and spatial filtering, the low-pass filter is applied to the frames of the video spatially and then downsampled using Laplacian Pyramid.
What is the Laplacian Pyramid?
To understand this first of all we need to understand Gaussian Pyramid.
The original image is convolved with a Gaussian kernel. As described above, the resulting image is a low pass filtered version of the original image. The cut-off frequency can be controlled using the parameter σ, which is standard deviation.
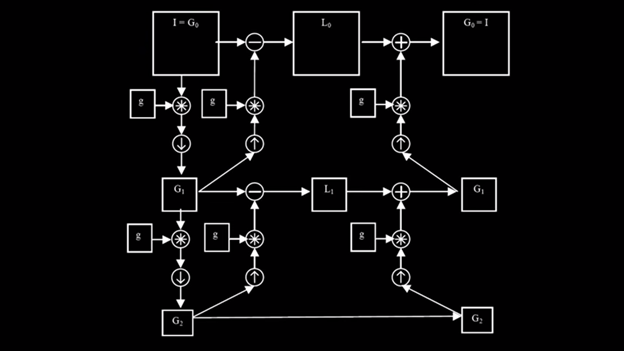
The Laplacian is then computed as the difference between the original image and the low pass filtered image i.e. it’s the difference between successive Gaussian pyramid levels. This process is continued to obtain a set of band-pass filtered images (since each is the difference between two levels of the Gaussian pyramid). Thus the Laplacian pyramid is a set of bandpass filters.
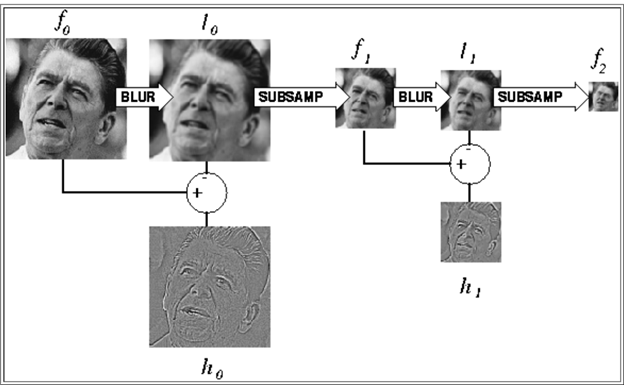
The original image is repeatedly filtered and subsampled to generate the sequence of reduced resolution images. These comprise a set of low pass filtered copies of the original image in which the bandwidth decreases in one-octave steps.
So after using Laplacian pyramid we then perform temporal processing on each spatial band. The time series corresponding to the value of a pixel in a frequency band is passed through a bandpass filter to extract the frequency bands of interest. For heart rate detection, I selected frequencies within 0.4–4Hz, corresponding to 24–240 beats per minute (this was specified in EVM paper itself) to magnify a pulse. The temporal processing is uniform for all spatial levels, and for all pixels within each level that is the time series of every pixel is passed through the same filter.
How is it Done?
Spatial Filtering: It is done to spatially filter the video sequence to obtain basebands of different spatial frequencies. The purpose of spatial filtering is simply to “spelt” multiple adjacent pixels into one piece, a low pass filter can be used. In fact, linear EVM uses Laplacian pyramids or Gaussian pyramids for multiresolution decomposition.
Time Domain Filtering: After obtaining the basebands of different spatial frequencies, bandpass filtering in the time domain is performed for each baseband in order to extract the part of the change signal we are interested in. For example, if we want to amplify the heart rate signal, we can choose bandpass filtering from 0.4 to 4 Hz (24 to 240 bpm). This band is the range of human heart rate.
Amplification:
\[\hat I(x,t) = f(x+(1+ \alpha)\delta(t)\]This represents Color Intensity of the pixels at location x in time t. δ(t) represents the displacement function. α is the amplification factor.
\(f(x + δ(t))\) in a first-order Taylor expansion about x, can be represented as:
\[I(x,t) \approx f(x) + \delta(t) \frac{\partial f(x)}{\partial x}\] \[f(x) = f(a) + f'(a)(x-a)\]This is first order Taylor expansion. Here \((x-a)\) is displacement function.
The temporal bandpass filter is selected to pull out the motions or signals that we wish to be amplified.
\[B(x,t) = \delta(t) \frac{\partial f(x)}{\partial x}\]This is a temporal Bandpass filter which is a result of applying a broadband temporal bandpass filter to \(I(x, t)\) at every position x. For now, \(\delta(t)\) is within the passband of the temporal bandpass filter.
Tip: For color amplification of blood flow, a narrow passband produces a more noise-free result.
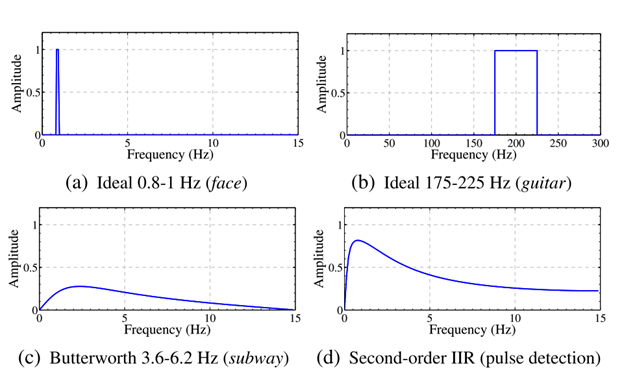
Important: The Butterworth filter is used to convert a user-specified frequency band into a second-order IIR (infinite impulse response) and is used in our real-time application.
This shows the frequency response of some of the temporal filters used in the paper. Ideal bandpass filters are used for color amplification as they have passbands with sharp cutoff frequencies.
For pulse detection, after computing Laplacian pyramid the magnification value or amplification factor α, for the finest two levels are set to 0. This causes downsampling and applies a spatial low pass filter to each frame to reduce both quantization and noise and to boost the subtle pulse signal that we are interested in. The incoming video frame is then passed through an ideal bandpass filter with a passband of 0.83 Hz to 1 Hz (50 bpm to 60 bpm). Finally, a large value of α ≈ 100 (amplification factor) and λc ≈ 1000 (cutoff frequency, beyond which an attenuated version of α is used that either forces α to zero for all λ < λc, or linearly scales α down to zero. This is an important parameter in controlling noise) was applied to the resulting spatially lowpass signal to emphasize the color change as much as possible. The final video was formed by adding this signal back to the original.
MIT Computer Program Reveals Invisible Motion in Video | The New York Times
In this video, we can see periodic green to red variations at the heartbeat and how blood perfuses the face.
“Higher α can exaggerate specific motions or color changes at the cost of increased noise.” In some cases, one can account for color clipping artifacts by attenuating the chrominance components of each frame. This approach achieves this by doing all the processing in the YIQ space. Users can attenuate the chrominance components, I and Q, before conversion to the original color space.
“The paper Eulerian Video Magnification for Revealing Subtle Changes in the World is the work of the MIT CSAIL team.”
Conclusion
This algorithm can find its use in many aspects of our life like in pulse oximetry which is limited to certain application areas (usually the fingertip) and bears the risk of the probe failing due to the movement of the patient or low perfusion of the hands during long-time recordings. These limitations can be overcome by the analysis of video signals using this technique, which do not depend on contact-based measurement hardware and can be applied to well-circulated body areas (e.g. the head).
The world’s expanding and aging population has created a demand for inexpensive, unobtrusive, automated healthcare solutions. Eulerian Video Magnification (EVM) aids in the development of these solutions by allowing for the extraction of physiological signals from video data. This paper examines the potential of thermal video in conjunction with EVM to extract physiological measures, particularly heart rate.
Follow me on Twitter @theujjwal9